LIVE479 PROPERTIESAVG YIELD 10.5%26 BUY SIGNALS
REFRESHED · 26 JUN 2026
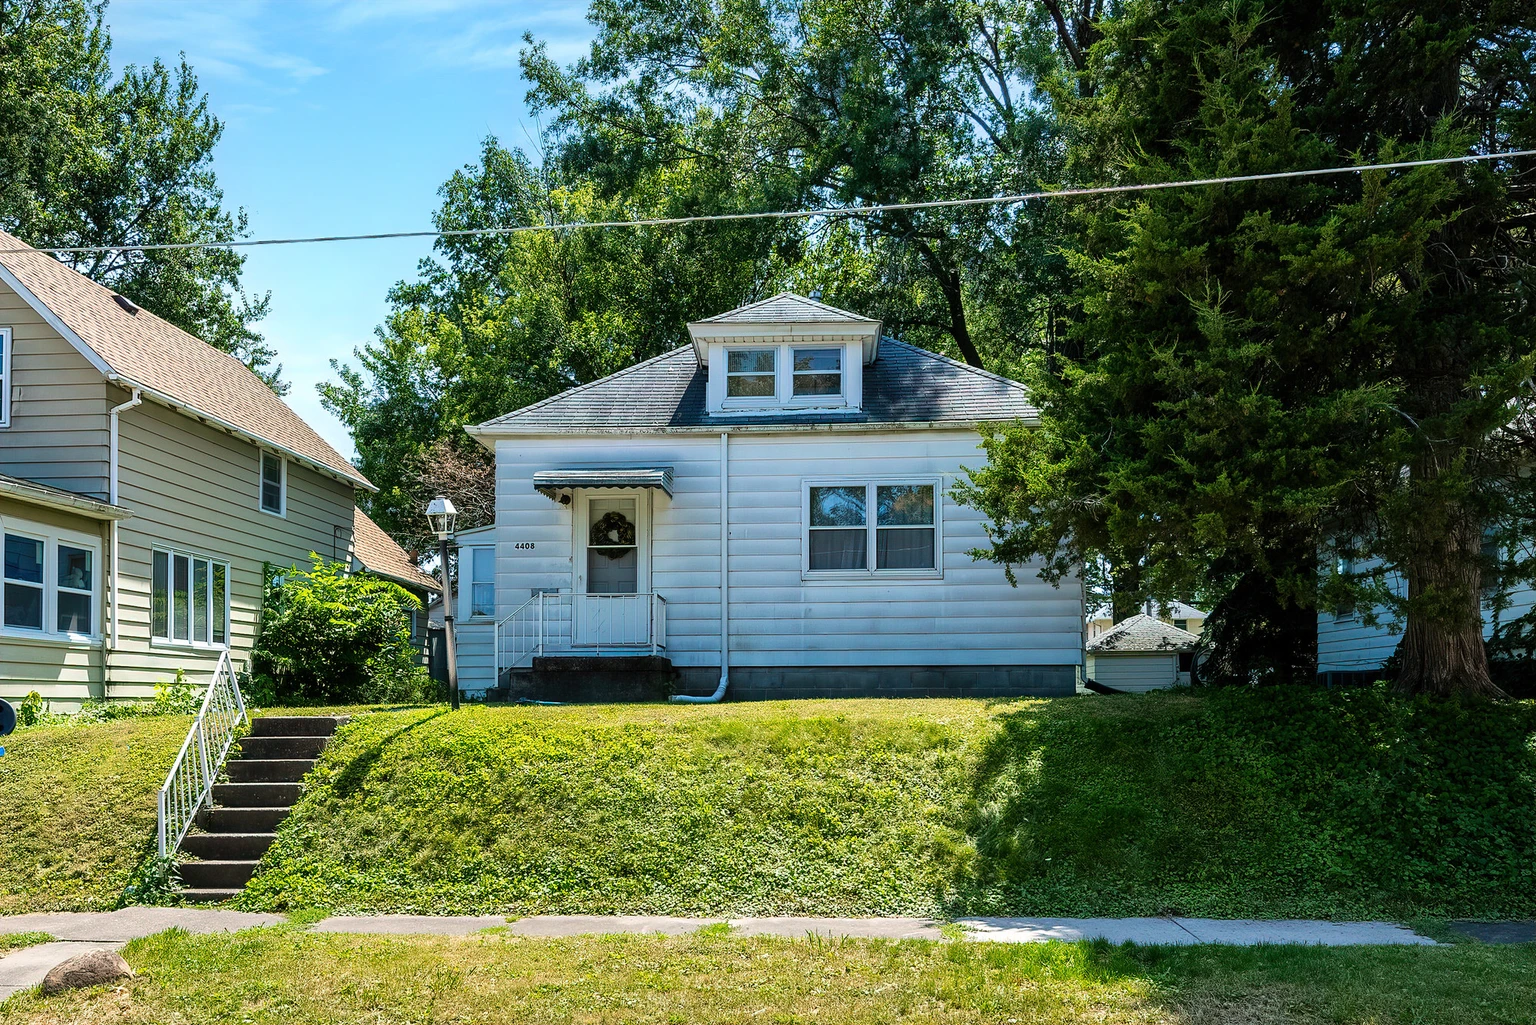
4408 17th Ave
New🇺🇸 Rock Island, US
77
Fair valueMediumLoftySingle FamilyBuilt 1945High Yield
How this compares
+5.6pp vs Rock Island avg
Rock Island avg: 13.7%
Better than 89% of listings
by overall score
€
€16.04/mo per €1,000
= €192/year · +€4.62 vs Rock Island avg
Why this looks attractive
- 12.2% net yield with 95% occupancy in Rock Island
Risks to consider
- Auto-discovered listing — confirm all data against the live Lofty listing before investing
Score breakdown
?
Yield score: net yield vs city average. Risk score: occupancy stability, build year, risk profile. Neighbourhood score: location quality and employment anchors. Value score: token price vs estimated fair value. Overall = weighted average (30/25/20/25).
Yield score91
Risk score72
Neighbourhood score68
Value score72
Overall score
better than 89% of listings
77
Occupancy rate
95%95% occupied — income is highly reliable. Platform avg: ~92%.
Similar properties
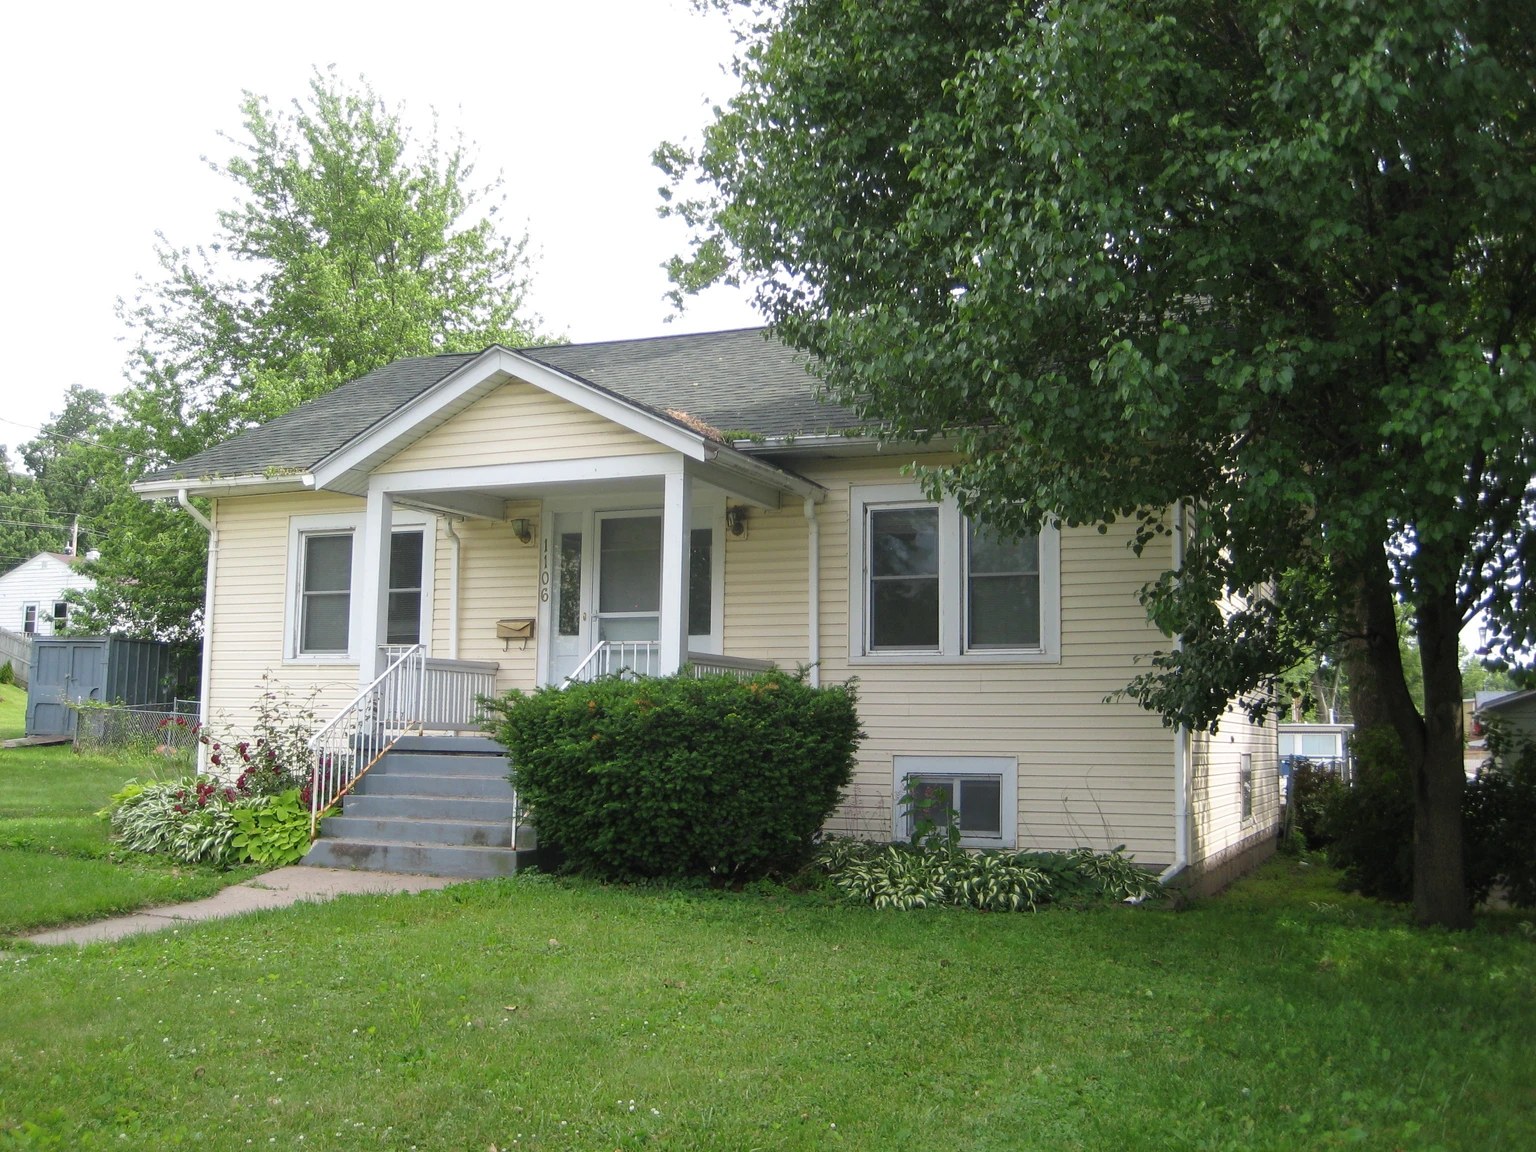
1106 29th Ave
🇺🇸 Rock Island · LoftySame city
12.52%
Buy
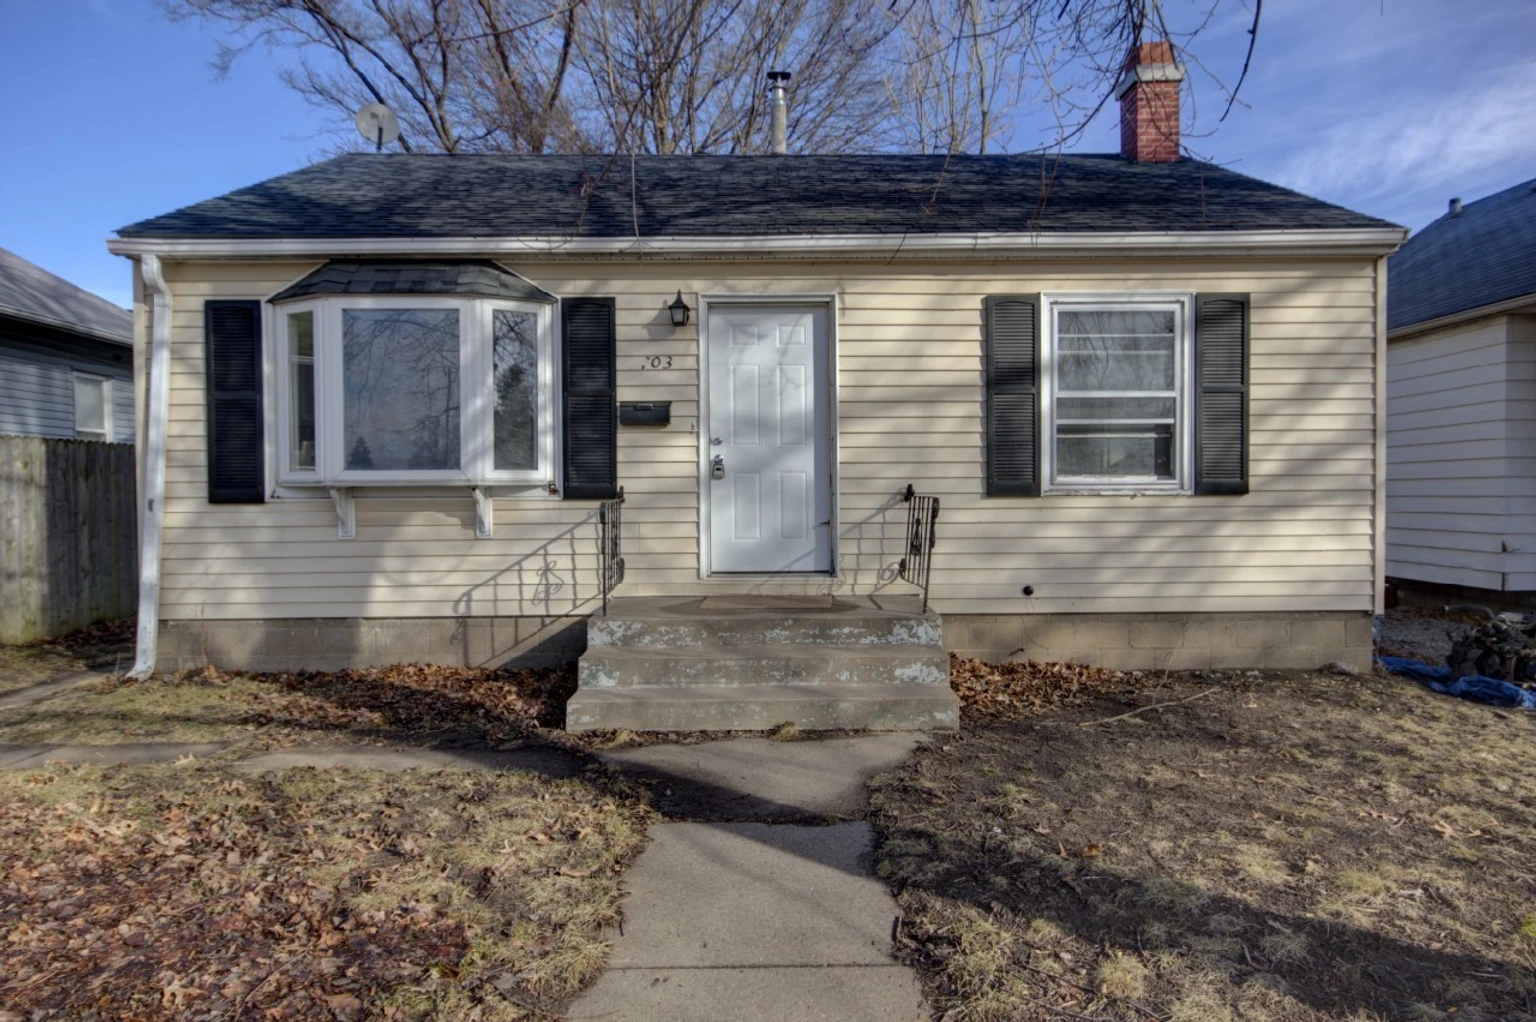
703 23rd Ave
🇺🇸 Rock Island · LoftySame city
9.4%
Avoid

4518 E 51st St
🇺🇸 Kansas City · Lofty
12.3%
Buy
Source: Lofty · Last updated: 2026-06-26 · Scores computed from yield vs market benchmarks, occupancy history, neighbourhood quality, and token fair-value estimate.
Brickwise verdict
Hold
Score 77 · 19.25% yield — +5.6pp above Rock Island avg — solid but no compelling entry signal
Medium confidence
95% occupancy · moderate consistency across metricsKey numbers
Net yield19.25%
Gross yield12.2%
Monthly rent€544
Occupancy95%
Property typeSingle Family
Year built1945
Size1,100 sqft
If you invest €1,000
€16.04
per month
€192
per year
+€4.62/mo vs Rock Island average
Income breakdown · monthly
Gross rent€544
Property tax−€38
Insurance−€16
Management−€44
Net income€446
Returns · 100 tokens
Investment€2.174
Annual net income€332
Monthly net income€28
Token info
Token price€21.74
Total supply1.610
Property value€35.001
PlatformLofty
Source✓ Verified
Last updated2026-06-26
Track properties like this
Get the weekly Brickwise Brief: 3 buy candidates, 3 avoid signals every Monday.
Scores and yield estimates are for informational purposes only and do not constitute financial advice. Past occupancy does not guarantee future income. Always review the offering documents on the issuing platform before investing.