LIVE479 PROPERTIESAVG YIELD 10.5%26 BUY SIGNALS
REFRESHED · 26 JUN 2026
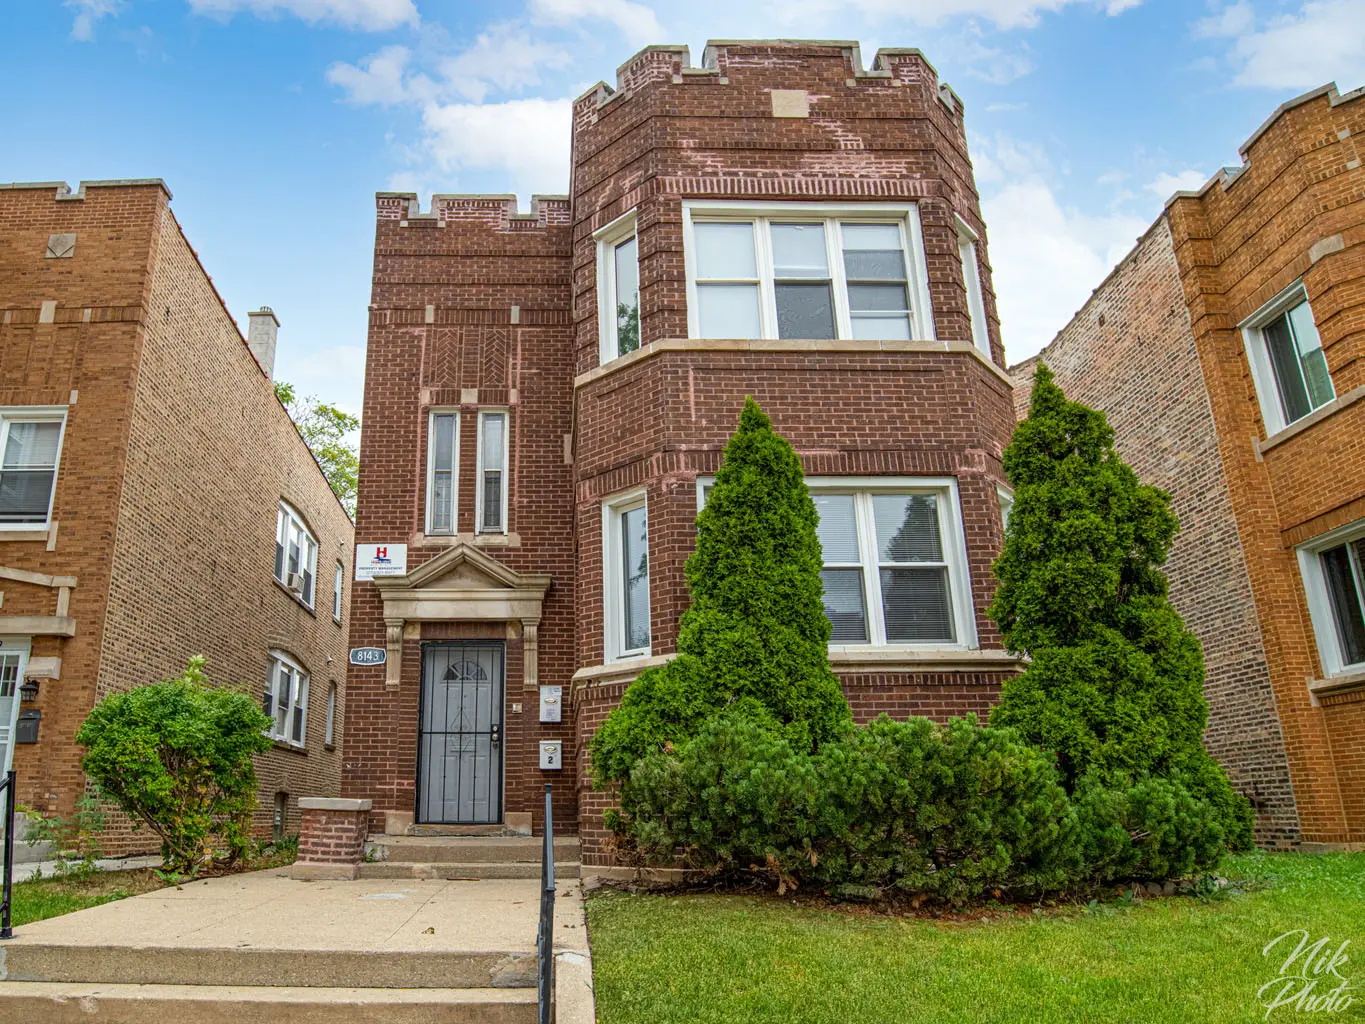
8143 S Sangamon St
New🇺🇸 Chicago, US
78
UndervaluedHighLoftySingle FamilyBuilt 1945High YieldValue Entry
How this compares
+3.2pp vs Chicago avg
Chicago avg: 11.9%
Better than 90% of listings
by overall score
€
€12.61/mo per €1,000
= €151/year · +€2.69 vs Chicago avg
Why this looks attractive
- 13.8% net yield with 75% occupancy in Chicago
Risks to consider
- Auto-discovered listing — confirm all data against the live Lofty listing before investing
Score breakdown
?
Yield score: net yield vs city average. Risk score: occupancy stability, build year, risk profile. Neighbourhood score: location quality and employment anchors. Value score: token price vs estimated fair value. Overall = weighted average (30/25/20/25).
Yield score99
Risk score56
Neighbourhood score68
Value score82
Overall score
better than 90% of listings
78
Occupancy rate
75%75% occupied — below 88% threshold. Income may vary significantly.
Similar properties
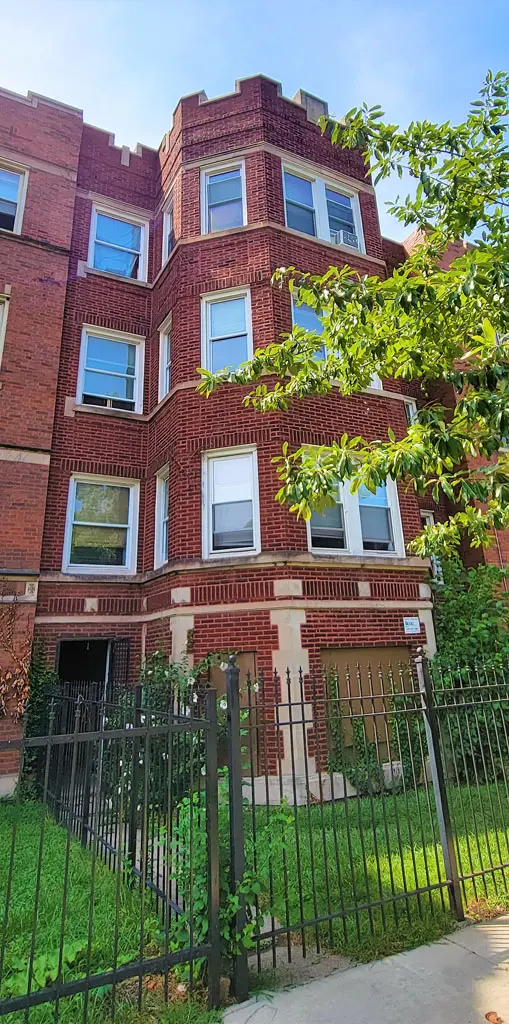
7542 and 7656 S Colfax Ave
🇺🇸 Chicago · LoftySame city
12.45%
Avoid
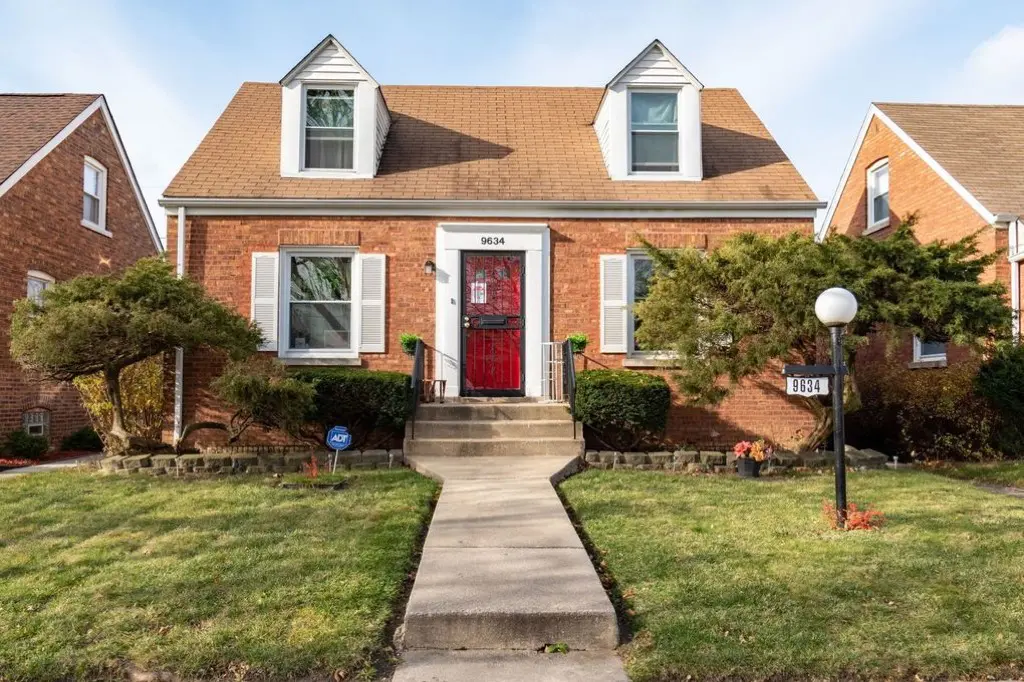
9634 S Green St
🇺🇸 Chicago · LoftySame city
24.25%
Avoid

5541 S Peoria St
🇺🇸 Chicago · LoftySame city
9.89%
Hold
Source: Lofty · Last updated: 2026-06-26 · Scores computed from yield vs market benchmarks, occupancy history, neighbourhood quality, and token fair-value estimate.
Brickwise verdict
Avoid
75% occupancy — persistent vacancy risk
Low confidence
75% occupancy limits income reliabilityKey numbers
Net yield15.13%
Gross yield13.8%
Monthly rent€1954
Occupancy75%
Property typeSingle Family
Year built1945
Size1,100 sqft
If you invest €1,000
€12.61
per month
€151
per year
+€2.69/mo vs Chicago average
Income breakdown · monthly
Gross rent€1954
Property tax−€137
Insurance−€59
Management−€156
Net income€1602
Returns · 100 tokens
Investment€2.194
Annual net income€274
Monthly net income€23
Token info
Token price€21.94
Total supply7.021
Property value€154.041
PlatformLofty
Source✓ Verified
Last updated2026-06-26
Track properties like this
Get the weekly Brickwise Brief: 3 buy candidates, 3 avoid signals every Monday.
Scores and yield estimates are for informational purposes only and do not constitute financial advice. Past occupancy does not guarantee future income. Always review the offering documents on the issuing platform before investing.